चित्र:Visual Smith Chart.png

इस पूर्वावलोकन का आकार: 513 × 600 पिक्सेल। दूसरे रेसोल्यूशन्स: 205 × 240 पिक्सेल | 410 × 480 पिक्सेल | 657 × 768 पिक्सेल | 1,146 × 1,340 पिक्सेल।
मूल चित्र ((1,146 × 1,340 पिक्सेल, फ़ाइल का आकार: 356 KB, MIME प्रकार: image/png))
|
|
यह फ़ाइल विकिमेडिया कॉमन्स से है। वहाँ पर इसका विवरण पृष्ठ निम्नोक्त है। कॉमन्स मुक्त लाइसेंसों के अंतर्गत उपलब्ध मीडिया फ़ाइलों का संग्रह है। आप भी इसमें मदद कर सकते हैं। |
Transferred from en.wikipedia to Commons by Maksim.
The original description page was here. All following user names refer to en.wikipedia.
सारांश
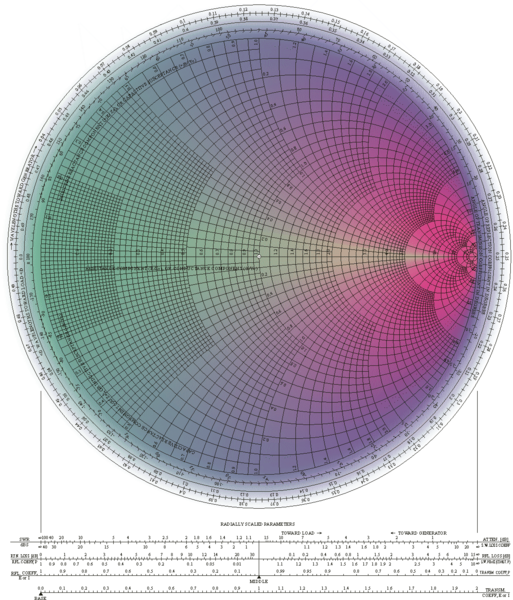
PNG image of SVG Visual Magic vector Smith Chart referencing 22m relative coefficient points plotted as a dual spectrum JPG background
Smith Chart visual representation of interaction between resistive and reactive components

|
This diagram image could be re-created using vector graphics as an SVG file. This has several advantages; see Commons:Media for cleanup for more information. If an SVG form of this image is available, please upload it and afterwards replace this template with
{{vector version available|new image name}}.
It is recommended to name the SVG file “Visual Smith Chart.svg”—then the template Vector version available (or Vva) does not need the new image name parameter. |
लाइसेंस
मैं, इस कार्य का/की कॉपीराइट धारक, इसे निम्न लाइसेंसों के अंतर्गत प्रकाशित करता/करती हूँ:

|
इस दस्तावेज़ को Free Software Foundation द्वारा प्रकाशित GNU मुक्त प्रलेख लाइसेंस के संस्करण 1.2 या नए (बिना किसी अपरिवर्तनीय अनुभागों और अगले या पिछले आवरण के टेक्स्ट के) के अंतर्गत प्रतिलिपि बनाने, बाँटने और/या बदलने की अनुमति प्रदान की जाती है। इस लाइसेंस की एक प्रतिलिपि GNU मुक्त प्रलेख लाइसेंस नामक अनुभाग में शामिल है। |
| इस फ़ाइल को क्रिएटिव कॉमन्स श्रेय-समानसांझा 3.0 अनरिपोर्टेड लाइसेंस के अंतर्गत लाइसेंस किया गया है। | ||
| ||
| This licensing tag was added to this file as part of the GFDL licensing update. |
आप अपना पसंद का लाइसेंस चुन सकते हैं।
| date/time | username | edit summary |
|---|---|---|
| 15:47, 4 January 2006 | en:User:Jamal al din | (PNG image of SVG Visual Magic vector Smith Chart referencing 22m relative coefficient points plotted as a dual spectrum JPG background Smith Chart visual representation of interaction between resistive and reactive compnents) |
मूल अपलोड लॉग
Legend: (cur) = this is the current file, (del) = delete this old version, (rev) = revert to this old version.
Click on date to download the file or see the image uploaded on that date.
- (del) (cur) 15:47, 4 January 2006 . . en:User:Jamal_al_din Jamal al din ( en:User_talk:Jamal_al_din Talk) . . 1146x1340 (364497 bytes) (PNG image of SVG Visual Magic vector Smith Chart referencing 22m relative coefficient points plotted as a dual spectrum JPG background Smith Chart visual representation of interaction between resistive and reactive compnents)
चित्र का इतिहास
फ़ाइलका पुराना अवतरण देखने के लिये दिनांक/समय पर क्लिक करें।
| दिनांक/समय | थंबनेल | आकार | सदस्य | प्रतिक्रिया | |
|---|---|---|---|---|---|
| वर्तमान | 20:05, 19 मार्च 2006 | | 1,146 × 1,340 (356 KB) | Maksim | La bildo estas kopiita de wikipedia:en. La originala priskribo estas: == Summary == PNG image of SVG Visual Magic vector Smith Chart referencing 22m relative coefficient points plotted as a dual spectrum JPG background Smith Chart visual representati |
चित्र का उपयोग
निम्नलिखित पन्ने इस चित्र से जुडते हैं :
चित्र का वैश्विक उपयोग
इस चित्र का उपयोग इन दूसरे विकियों में किया जाता है:
- ar.wikipedia.org पर उपयोग
- az.wikipedia.org पर उपयोग
- be.wikipedia.org पर उपयोग
- ca.wikipedia.org पर उपयोग
- da.wikipedia.org पर उपयोग
- de.wikipedia.org पर उपयोग
- en.wikipedia.org पर उपयोग
- eo.wikipedia.org पर उपयोग
- es.wikipedia.org पर उपयोग
- gl.wiktionary.org पर उपयोग
- it.wikipedia.org पर उपयोग
- nl.wikipedia.org पर उपयोग
- nl.wikibooks.org पर उपयोग
- pt.wikipedia.org पर उपयोग
- ro.wikipedia.org पर उपयोग
- ru.wikipedia.org पर उपयोग
- sv.wikipedia.org पर उपयोग
- vi.wikipedia.org पर उपयोग
- zh.wikipedia.org पर उपयोग