चित्र:Correlation examples.png

इस पूर्वावलोकन का आकार: 800 × 336 पिक्सेल। दूसरे रेसोल्यूशन्स: 320 × 134 पिक्सेल | 824 × 346 पिक्सेल।
मूल चित्र ((824 × 346 पिक्सेल, फ़ाइल का आकार: 15 KB, MIME प्रकार: image/png))
|
|
यह फ़ाइल विकिमेडिया कॉमन्स से है। वहाँ पर इसका विवरण पृष्ठ निम्नोक्त है। कॉमन्स मुक्त लाइसेंसों के अंतर्गत उपलब्ध मीडिया फ़ाइलों का संग्रह है। आप भी इसमें मदद कर सकते हैं। |
| विवरण | See below. |
| दिनांक | ८ दिसम्बर २००७ (original upload date) |
| स्रोत |
Transferred from en.wikipedia to Commons by jtneill. इस PNG ग्राफ़िक को Mathematica की मदद से बनाया गया था। |
| लेखक | अंग्रेज़ी विकिपीडिया पर Imagecreator |
| दूसरे संस्करण | File:CovrarianceCorrelation.svg, File:Correlation examples2.svg |

|
File:Correlation examples2.svg is a vector version of this file. It should be used in place of this PNG file when not inferior.
File:Correlation examples.png → File:Correlation examples2.svg
For more information, see Help:SVG. |
 |
|
|
[[:File:CovrarianceCorrelaخن
tion.svg]] is a vector version of this file.
Error: No SVG image by that name exists. Please make sure to use the correct format: {{Vector version available|new image name}}. File:Correlation examples.png → [[:File:CovrarianceCorrelaخن
tion.svg]]
For more information, see Help:SVG. |
[[File:CovrarianceCorrelaخن
tion.svg|New SVG image|150x150px]] |
सारांश
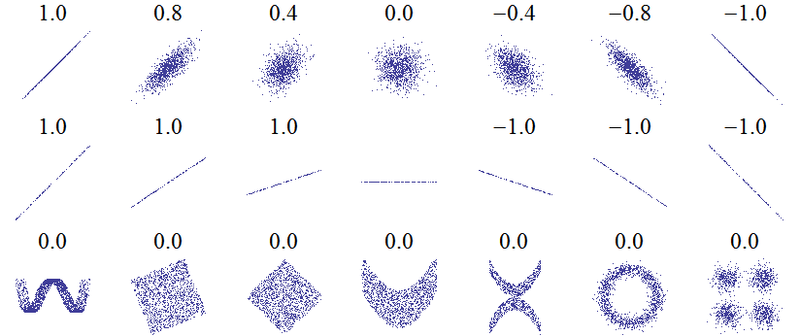
An example of the correlation of x and y for various distributions of (x,y) pairs. It was created by this Mathematica 6 code, which I wrote and release into the public domain (needs makePlot!):
n = 2000;
GraphicsArray[{
  Table[makePlot[
    Table[{RandomReal[NormalDistribution[0, 1]], (1 - Abs[w])*
        RandomReal[NormalDistribution[0, 1]]} .
      RotationMatrix[-Sign[w]*Pi/4], {i, -1, 1, 2./n}], 1000], {w,
    1, -1, -1/3}],
  Table[makePlot[Table[{x, slope*x}, {x, -1, 1, 2./n}], 100], {slope,
    1, -1, -1/3}],
  {
   makePlot[
    Table[{x + RandomReal[]/3,
      4 (x^2 - 1/2)^2 + RandomReal[]/500} , {x, -1, 1, 2./n}], 2000],
   makePlot[
    Table[{RandomReal[{-1, 1}], RandomReal[{-1, 1}]} .
      RotationMatrix[-Pi/8], {x, -1, 1, 2./n}], 1400],
   makePlot[
    Table[{RandomReal[{-1, 1}], RandomReal[{-1, 1}]} .
      RotationMatrix[-Pi/4], {x, -1, 1, 2./n}], 1400],
   makePlot[Table[{x, x^2 + RandomReal[]}/2, {x, -1, 1, 2./n}],
    1400],
   makePlot[
    Table[{x, x^2 + RandomReal[]/2}*(RandomInteger[1]*2 - 1), {x, -1,
      1, 2./n}], 1000],
   makePlot[
    Table[{Sin[x*Pi] + RandomReal[NormalDistribution[0, 1/8]],
      Cos[x*Pi] + RandomReal[NormalDistribution[0, 1/8]]}, {x, -1, 1,
      2./n}], 1400],
   makePlot[
    Table[{RandomReal[NormalDistribution[0, 1/3]],
       RandomReal[
        NormalDistribution[0, 1/3]]} + {RandomInteger[1]*2 - 1,
       RandomInteger[1]*2 - 1}, {x, -1, 1, 2./n}], 1400]
   }
  }]
लाइसेंस
| इस कार्य को इसके लेखक, अंग्रेज़ी विकिपीडिया पर Imagecreator द्वारा सार्वजनिक डोमेन में प्रकाशित किया गया है। यह पूरे विश्व में लागू होता है। कुछ देशों में यह कानूनी तौर पर नहीं हो सकता है; ऐसा हो तो: Imagecreator सभी को इस कार्य का इस्तेमाल किसी भी उद्देश्य से, बिना किसी बाधाओं के इन शर्तों के कानून द्वारा अनिवार्य किए तक करने की अनुमति देता/देती हैं। |
मूल अपलोड लॉग
The original description page was here. All following user names refer to en.wikipedia.
- 2007-12-08 19:16 Imagecreator 824×346×8 (20371 bytes) == Summary == An example of the correlation of x and y for various distributions of (x,y) pairs. It was created by this Mathematica 6 code, which I wrote and release into the public domain: <pre> (*Several sets of (x,y) points, with the correlation coef
- 2007-12-08 18:48 Imagecreator 824×346×8 (21374 bytes) An example of the correlation of x and y for various distributions of (x,y) pairs. It was created by this Mathematica 6 code, which I wrote and release into the public domain: (*Several sets of (x,y) points, with the correlation coefficient of x \ and y
चित्र का इतिहास
फ़ाइलका पुराना अवतरण देखने के लिये दिनांक/समय पर क्लिक करें।
| दिनांक/समय | थंबनेल | आकार | सदस्य | प्रतिक्रिया | |
|---|---|---|---|---|---|
| वर्तमान | 09:33, 2 फ़रवरी 2010 | | 824 × 346 (15 KB) | JBW | Removing "0.0" for correlation coefficient from horizontal line: here corr. coeff. is undefined. |
| 10:27, 18 मार्च 2008 |  | 824 × 346 (20 KB) | Jtneill | {{Information |Description={{en|An example of the correlation of x and y for various distributions of (x,y) pairs. It was created by this Mathematica 6 code, which I wrote and release into the public domain: n = 2000; GraphicsArray[{ Table[makePlot[ |
चित्र का उपयोग
निम्नलिखित पन्ने इस चित्र से जुडते हैं :
चित्र का वैश्विक उपयोग
इस चित्र का उपयोग इन दूसरे विकियों में किया जाता है:
- ar.wikipedia.org पर उपयोग
- bg.wikipedia.org पर उपयोग
- de.wikipedia.org पर उपयोग
- de.wikibooks.org पर उपयोग
- Mathematrix: AT BRP/ Theorie/ Reifeniveau 6
- Mathematrix: MA TER/ Theorie/ Statistik und Wahrscheinlichkeitsrechnung
- Mathematrix: AT BRP/ Theorie nach Thema/ Statistik und Wahrscheinlichkeitsrechnung
- Mathematrix: AT AHS/ Theorie nach Thema/ Statistik und Wahrscheinlichkeitsrechnung
- Mathematrix: BY GYM/ Theorie nach Thema/ Statistik und Wahrscheinlichkeitsrechnung
- en.wikipedia.org पर उपयोग
- it.wikipedia.org पर उपयोग
- lt.wikipedia.org पर उपयोग
- pl.wikipedia.org पर उपयोग
- th.wikipedia.org पर उपयोग
- tr.wikipedia.org पर उपयोग