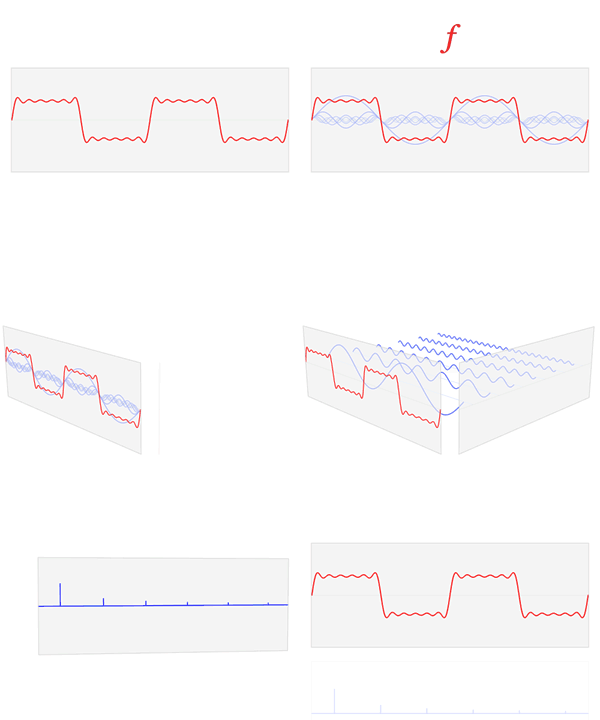
चित्र:Fourier transform time and frequency domains.gif
Fourier_transform_time_and_frequency_domains.gif ((500 × 400 पिक्सेल, फ़ाइल का आकार: 399 KB, MIME प्रकार: image/gif), चक्रित, 93 ढाँचे, 37 s)
चित्र का इतिहास
फ़ाइलका पुराना अवतरण देखने के लिये दिनांक/समय पर क्लिक करें।
| दिनांक/समय | थंबनेल | आकार | सदस्य | प्रतिक्रिया | |
|---|---|---|---|---|---|
| वर्तमान | 20:42, 23 फ़रवरी 2013 |  | 500 × 400 (399 KB) | LucasVB | Reverted to version as of 20:31, 23 February 2013 |
| 20:38, 23 फ़रवरी 2013 |  | 500 × 400 (684 KB) | LucasVB | Trying to circumvent MediaWiki's crappy thumbnail generator again. Completely unoptimized the animation. | |
| 20:31, 23 फ़रवरी 2013 |  | 500 × 400 (399 KB) | LucasVB | The new GIF scaling algorithm used on MediaWiki is awful, and adds a bunch of horrible artifacts to the animated thumbs. This is an attempt at avoiding the artifacts using an alternate palette. If this doesn't work, I'll have to submit the smaller vers... | |
| 11:43, 23 फ़रवरी 2013 |  | 500 × 400 (346 KB) | LucasVB | {{Information |Description=A visualization of the relationship between the time domain and the frequency domain of a function, based on its Fourier transform. |Source={{own}} |Date=2013-02-23 |Author= Lucas V. Barbosa |Permission={{PD-... |
चित्र का उपयोग
निम्नलिखित पन्ने इस चित्र से जुडते हैं :
चित्र का वैश्विक उपयोग
इस चित्र का उपयोग इन दूसरे विकियों में किया जाता है:
- ar.wikipedia.org पर उपयोग
- bn.wikipedia.org पर उपयोग
- en.wikipedia.org पर उपयोग
- en.wikiversity.org पर उपयोग
- eu.wikipedia.org पर उपयोग
- fr.wikipedia.org पर उपयोग
- ru.wikipedia.org पर उपयोग
- www.wikidata.org पर उपयोग

