चित्र:Fujita scale technical.svg

पूर्वावलोकन PNG का आकार SVG फ़ाइल: 428 × 560 पिक्सेल दूसरे रेसोल्यूशन्स: 183 × 240 पिक्सेल | 367 × 480 पिक्सेल | 587 × 768 पिक्सेल | 783 × 1,024 पिक्सेल | 1,565 × 2,048 पिक्सेल।
मूल चित्र (SVG फ़ाइल, साधारणतः 428 × 560 पिक्सेल, फ़ाइल का आकार: 376 KB)
|
|
यह फ़ाइल विकिमेडिया कॉमन्स से है। वहाँ पर इसका विवरण पृष्ठ निम्नोक्त है। कॉमन्स मुक्त लाइसेंसों के अंतर्गत उपलब्ध मीडिया फ़ाइलों का संग्रह है। आप भी इसमें मदद कर सकते हैं। |
सारांश
| विवरण |
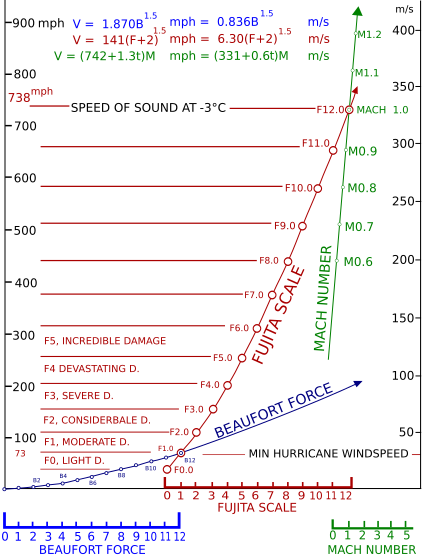
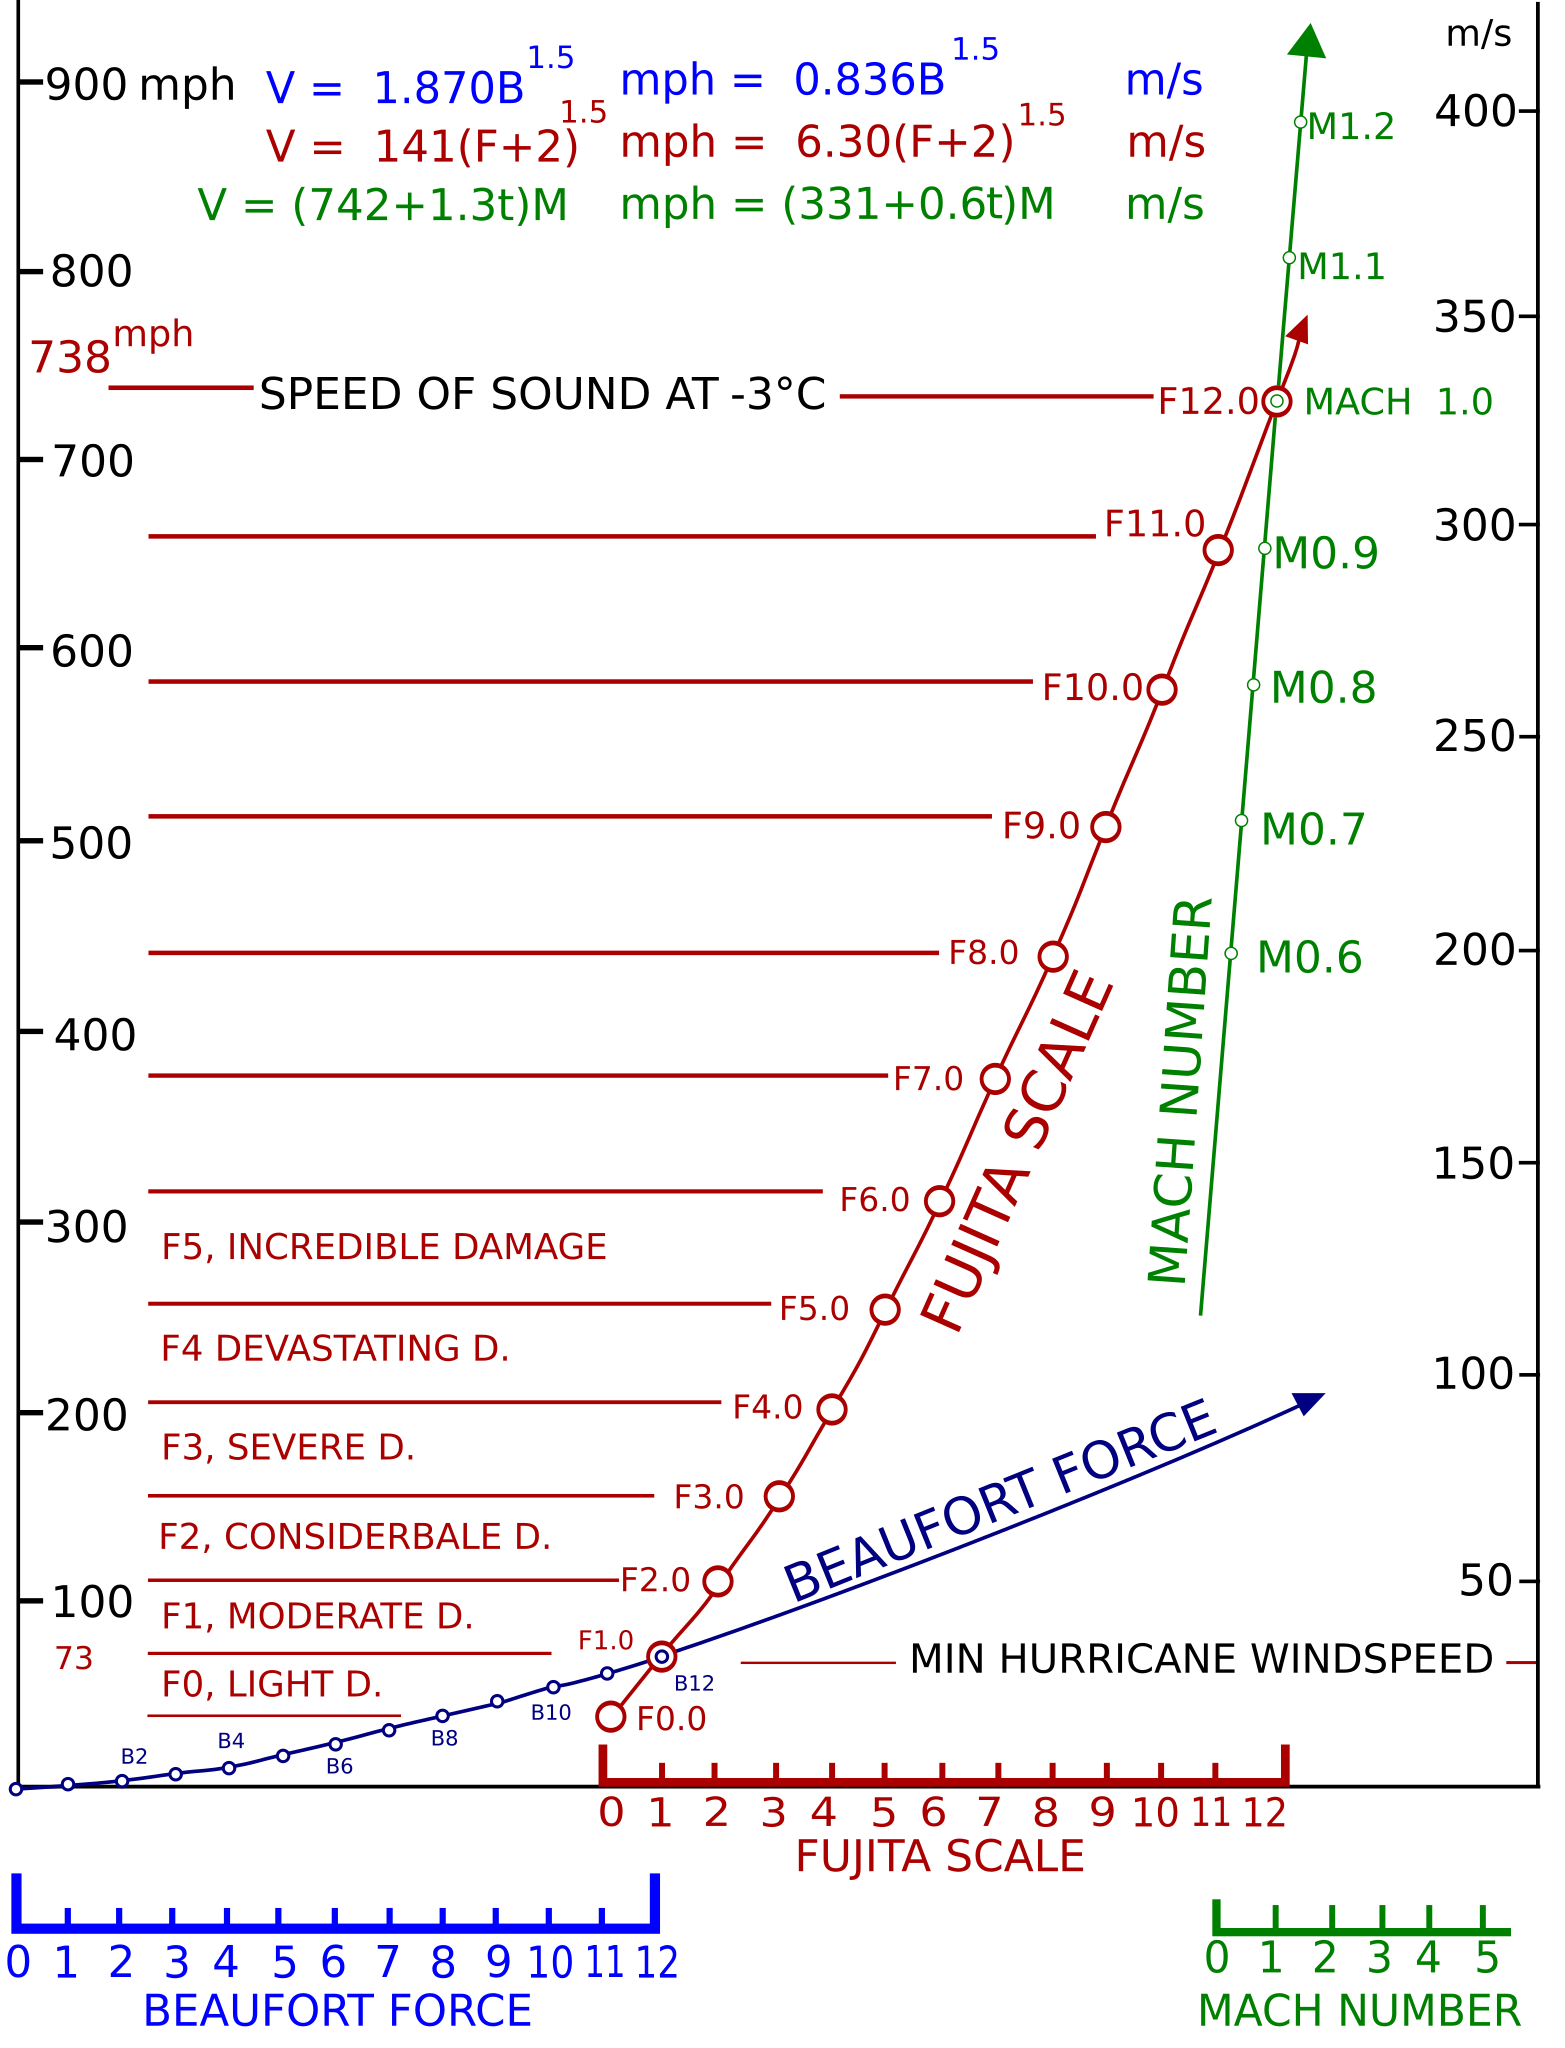
Français : Graphique de Dr. Ted Fujita (1920-1998) pour expliquer les détails technique de l'échelle qu'il a créé pour l'intensité des tornades. Elle fut publié dans un journal scientifique mais le docteur et sa famille l'ont ensuite rendue à l'usage public à condition de citer son origine
English: This is a schematic produced by Dr. Ted Fujita (1920-1998) when explaining the technical details of the Fujita tornado intensity scale when he introduced it. It was originally published in a science journal but he and his family have released all his available works for public use. Proper citation is still warranted, of course. |
| दिनांक | |
| स्रोत | "Proposed characterization of tornadoes and hurricanes by area and intensity". Satellite Mesometeorology Research Program Research Paper Number 91, Department of Geophysical Sciences, University of Chicago. 42pp. (pdf version https://archive.org/download/nasa_techdoc_19720008829/19720008829.pdf) |
| लेखक | Fujita, T.T. ,SVG Version - Rugby471 |
| दूसरे संस्करण |
Derivative works of this file: Fujita scale technical-es.svg
|


If an f12 tornado were to hit anything that even got remotely close to it would be shredded into tiny bits
लाइसेंस

|
इस फ़ाइल के कॉपीराइट धारक ने इस फ़ाइल का किसी भी उद्देश्य से इस्तेमाल करने की अनुमति दी है, अगर कॉपीराइट धारक को ठीक से श्रेय दिया जाए। पुनः वितरण, व्युत्पन्न कार्य, वाणिज्यिक उपयोग, और सभी प्रकारों के उपयोग की अनुमति है। |
श्रेय:
Dr. Ted Fujita published this diagram in Satellite Mesometeorology Research Program Research Paper Number 91, 1971, for public use. Description of license is at https://archive.org/details/nasa_techdoc_19720008829. The SGV version has been done by Rugby471
|
चित्र का इतिहास
फ़ाइलका पुराना अवतरण देखने के लिये दिनांक/समय पर क्लिक करें।
| दिनांक/समय | थंबनेल | आकार | सदस्य | प्रतिक्रिया | |
|---|---|---|---|---|---|
| वर्तमान | 08:29, 2 जून 2007 | | 428 × 560 (376 KB) | Rugby471 | Last EDIT |
| 08:15, 2 जून 2007 |  | 428 × 560 (375 KB) | Rugby471 | 3rd EDIT | |
| 07:44, 2 जून 2007 |  | 428 × 560 (376 KB) | Rugby471 | 2nd EDIT | |
| 18:11, 1 जून 2007 |  | 428 × 560 (378 KB) | Rugby471 | Spare code making it not display properly | |
| 17:58, 1 जून 2007 |  | 428 × 560 (379 KB) | Rugby471 | == Summary == This is a schematic produced by Dr. Ted Fujita (1920-1998) when explaining the technical details of the Fujita tornado intensity scale when he introduced it. It was originally published in a science journal but he and his family have release |
चित्र का उपयोग
निम्नलिखित पन्ने इस चित्र से जुडते हैं :
चित्र का वैश्विक उपयोग
इस चित्र का उपयोग इन दूसरे विकियों में किया जाता है:
- ar.wikipedia.org पर उपयोग
- cs.wikipedia.org पर उपयोग
- de.wikipedia.org पर उपयोग
- el.wikipedia.org पर उपयोग
- en.wikipedia.org पर उपयोग
- fi.wikipedia.org पर उपयोग
- fr.wikipedia.org पर उपयोग
- ja.wikipedia.org पर उपयोग
- kn.wikipedia.org पर उपयोग
- ko.wikipedia.org पर उपयोग
- lv.wikipedia.org पर उपयोग
- pl.wikipedia.org पर उपयोग
- pl.wikiquote.org पर उपयोग
- pt.wikipedia.org पर उपयोग
- ru.wikinews.org पर उपयोग
- smn.wikipedia.org पर उपयोग
- vi.wikipedia.org पर उपयोग