चित्र:Normal Distribution CDF.svg

पूर्वावलोकन PNG का आकार SVG फ़ाइल: 720 × 460 पिक्सेल दूसरे रेसोल्यूशन्स: 320 × 204 पिक्सेल | 640 × 409 पिक्सेल | 1,024 × 654 पिक्सेल | 1,280 × 818 पिक्सेल | 2,560 × 1,636 पिक्सेल।
मूल चित्र (SVG फ़ाइल, साधारणतः 720 × 460 पिक्सेल, फ़ाइल का आकार: 76 KB)
|
|
यह फ़ाइल विकिमेडिया कॉमन्स से है। वहाँ पर इसका विवरण पृष्ठ निम्नोक्त है। कॉमन्स मुक्त लाइसेंसों के अंतर्गत उपलब्ध मीडिया फ़ाइलों का संग्रह है। आप भी इसमें मदद कर सकते हैं। |
सारांश
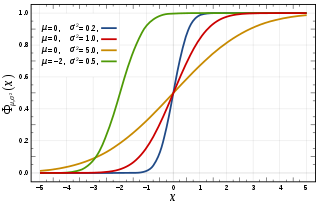
| विवरण | A selection of Normal Distribution Cumulative Density Functions (CDFs). Both the mean, μ, and variance, σ², are varied. The key is given on the graph. | ||
| दिनांक | |||
| स्रोत | अपना कार्य (Original text: self-made, Mathematica, Inkscape) | ||
| लेखक | Inductiveload | ||
| अनुमति (इस चित्र का पुनः उपयोग करना) |
|
||
| दूसरे संस्करण | Derivative works of this file: CumulativeSD.svg | ||
| SVG genesis | इस वेक्टर चित्र को Inkscape की मदद से बनाया गया था। This trigonometry uses embedded text. |
Mathematica Code
Plot[
 {
  CDF[NormalDistribution[0, Sqrt[0.2]], x],
  CDF[NormalDistribution[0, 1], x],
  CDF[NormalDistribution[0, Sqrt[5]], x],
  CDF[NormalDistribution[-2, Sqrt[0.5]], x]
  },
 {x, -5, 5},
 PlotRange -> All,
 Axes -> False]
R language Code
#Normal Distribution - Cumulative Density Function (CDF)
#range
x=seq(-5,5,length=200)
#plot each curve
plot(x,pnorm(x,mean=0,sd=sqrt(.2)),type="l",lwd=2,col="blue",main='Cumulative Density Function CDF',xlim=c(-5,5),ylim=c(0,1),xlab='X',
ylab='φμ, σ²(X)')
curve(pnorm(x,mean=0,sd=1), add=TRUE,type="l",lwd=2,col="red")
curve(pnorm(x,mean=0,sd=sqrt(5)), add=TRUE,type="l",lwd=2,col="yellow")
curve(pnorm(x,mean=-2,sd=sqrt(.5)), add=TRUE,type="l",lwd=2,col="green")
चित्र का इतिहास
फ़ाइलका पुराना अवतरण देखने के लिये दिनांक/समय पर क्लिक करें।
| दिनांक/समय | थंबनेल | आकार | सदस्य | प्रतिक्रिया | |
|---|---|---|---|---|---|
| वर्तमान | 16:17, 29 अप्रैल 2016 | | 720 × 460 (76 KB) | Rayhem | Lighten background grid |
| 16:17, 12 सितंबर 2014 |  | 720 × 460 (73 KB) | Wereldburger758 | Valid SVG now. | |
| 21:12, 23 सितंबर 2009 |  | 720 × 460 (84 KB) | Stpasha | re-uploading same file, since upload is buggy | |
| 19:28, 23 सितंबर 2009 |  | 720 × 460 (84 KB) | Stpasha | Lines are made thicker and more visible, all numbers rendered in roman instead of italic, white background added | |
| 14:14, 27 जून 2009 |  | 720 × 460 (55 KB) | Autiwa | nouvelle version où j'ai enlevé la courbe qui était en double. (en gros, j'ai enlevé la grosse version de 600 points, pour garder la petite) | |
| 19:17, 2 अप्रैल 2008 |  | 720 × 460 (80 KB) | Inductiveload | Cliiping path caused rendering fault. hopefully fixed now. | |
| 19:12, 2 अप्रैल 2008 |  | 720 × 460 (78 KB) | Inductiveload | {{Information |Description= |Source= |Date= |Author= |Permission= |other_versions= }} | |
| 19:10, 2 अप्रैल 2008 |  | 720 × 460 (78 KB) | Inductiveload | {{Information |Description=A selection of Normal Distribution Cumulative Density Functions (CDFs). Both the mean, ''μ'', and variance, ''σ²'', are varied. The key is given on the graph. |Source=self-made, Mathematica, Inkscape |Date=02/04/2008 |Author= |
चित्र का उपयोग
निम्नलिखित पन्ने इस चित्र से जुडते हैं :
चित्र का वैश्विक उपयोग
इस चित्र का उपयोग इन दूसरे विकियों में किया जाता है:
- als.wikipedia.org पर उपयोग
- ar.wikipedia.org पर उपयोग
- be.wikipedia.org पर उपयोग
- bg.wikipedia.org पर उपयोग
- ca.wikipedia.org पर उपयोग
- cs.wikipedia.org पर उपयोग
- cv.wikipedia.org पर उपयोग
- de.wikipedia.org पर उपयोग
- de.wikiversity.org पर उपयोग
- el.wikipedia.org पर उपयोग
- en.wikipedia.org पर उपयोग
- Cumulative distribution function
- Normal distribution
- Template:Infobox probability distribution
- Template:Infobox probability distribution/doc
- Talk:Normal distribution/Archive 4
- User:OneThousandTwentyFour/sandbox
- Template:Infobox probability distribution/sandbox
- Template:Infobox probability distribution/testcases
- en.wikibooks.org पर उपयोग
- en.wikiversity.org पर उपयोग
- eo.wikipedia.org पर उपयोग
- es.wikipedia.org पर उपयोग
- et.wikipedia.org पर उपयोग
- eu.wikipedia.org पर उपयोग
- fa.wikipedia.org पर उपयोग
- fi.wikipedia.org पर उपयोग
- fr.wikipedia.org पर उपयोग
- ga.wikipedia.org पर उपयोग
- id.wikipedia.org पर उपयोग
- it.wikipedia.org पर उपयोग
- ja.wikipedia.org पर उपयोग
- ka.wikipedia.org पर उपयोग
- kn.wikipedia.org पर उपयोग
- ko.wikipedia.org पर उपयोग
- la.wikipedia.org पर उपयोग
- lt.wikipedia.org पर उपयोग
- lv.wikipedia.org पर उपयोग
इस चित्र के वैश्विक उपयोग की अधिक जानकारी देखें।