चित्र:Rahul Dravid Graph.png

इस पूर्वावलोकन का आकार: 800 × 466 पिक्सेल। दूसरे रेसोल्यूशन्स: 320 × 186 पिक्सेल | 640 × 373 पिक्सेल | 986 × 574 पिक्सेल।
मूल चित्र ((986 × 574 पिक्सेल, फ़ाइल का आकार: 7 KB, MIME प्रकार: image/png))
|
|
यह फ़ाइल विकिमेडिया कॉमन्स से है। वहाँ पर इसका विवरण पृष्ठ निम्नोक्त है। कॉमन्स मुक्त लाइसेंसों के अंतर्गत उपलब्ध मीडिया फ़ाइलों का संग्रह है। आप भी इसमें मदद कर सकते हैं। |
सारांश
| विवरण |
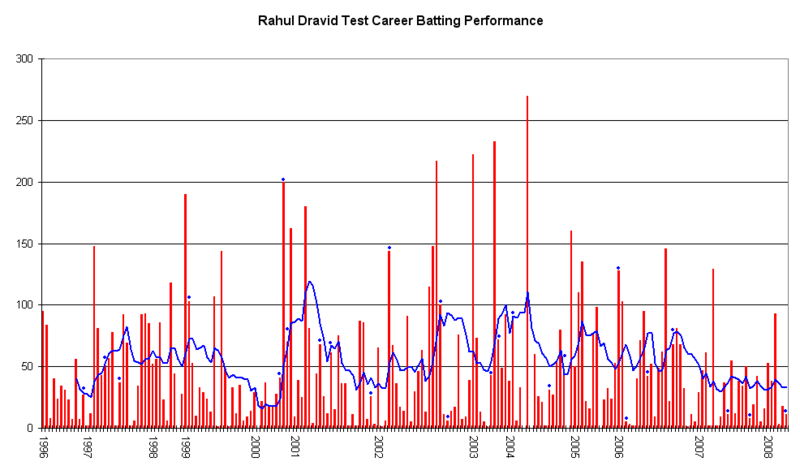
English: This graph details the Test Match performance of Rahul Dravid. The red bars indicate the player's test match innings, while the blue line shows the average of the ten most recent innings at that point. Note that this average cannot be calculated for the first nine innings. The blue dots indicate innings in which Dravid finished not-out.
This graph was generated with Microsoft Excel 2002, using data from Cricinfo [1] and Howstat [2]. The information in this chart is current as of 2 February, 2008. |
| दिनांक | १ नवम्बर २००५ (original upload date) |
| स्रोत |
अपना कार्य Transferred from en.wikipedia |
| लेखक | Raven4x4x at en.wikipedia |

|
This graph image could be re-created using vector graphics as an SVG file. This has several advantages; see Commons:Media for cleanup for more information. If an SVG form of this image is available, please upload it and afterwards replace this template with
{{vector version available|new image name}}.
It is recommended to name the SVG file “Rahul Dravid Graph.svg”—then the template Vector version available (or Vva) does not need the new image name parameter. |

|
This file requires updating. In doing so, you could add a timestamp to the file.
|
लाइसेंस
| |
इस कार्य को इसके लेखक, Raven4x4x, at the अंग्रेज़ी विकिपीडिया project द्वारा सार्वजनिक डोमेन में प्रकाशित किया गया है। यह पूरे विश्व में लागू होता है। In case this is not legally possible: |
मूल अपलोड लॉग
The original description page was here. All following user names refer to en.wikipedia.
- 2005-11-01 09:53 Raven4x4x 963×492 (7639 bytes) This graph details the [[Test cricket|Test Match]] performance of [[Rahul Dravid]]. The red bars indicate the player's test match innings, while the blue line shows the [[Batting average|average]] of the ten most recent innings at that point. Note that th
- 2005-11-14 02:01 Raven4x4x 963×492 (7228 bytes) Removed unwanted grey line from edge
- 2005-12-23 03:41 Raven4x4x 963×492 (6966 bytes) updated: current as of 23 December 2005.
- 2006-02-02 08:24 Raven4x4x 963×492 (7005 bytes) Information in this chart is current as of 2 February 2006.
- 2006-04-23 04:39 Raven4x4x 957×539 (7226 bytes) updated: Information is current as of 23 April 2006
- 2006-07-03 06:19 Raven4x4x 963×492 (7109 bytes) updated. The information in this graph is current as of 3 July 2006.
- 2007-01-10 00:36 Raven4x4x 986×574 (6454 bytes) Updated: The information in this chart is current as of 10 January 2007
- 2007-06-02 02:20 Raven4x4x 986×574 (6658 bytes) Updated: The information in this chart is current as of 2 June, 2007.
- 2007-08-28 01:49 Raven4x4x 986×574 (6683 bytes) Updated: The information in this chart is current as of 28 August 2007.
- 2007-12-16 01:52 Raven4x4x 986×574 (6694 bytes) Updated: The information in this chart is current as of 16 December 2007.
- 2008-02-02 07:39 Raven4x4x 986×574 (6730 bytes) Updated: The information in this chart is current as of 2 February, 2007.
चित्र का इतिहास
फ़ाइलका पुराना अवतरण देखने के लिये दिनांक/समय पर क्लिक करें।
| दिनांक/समय | थंबनेल | आकार | सदस्य | प्रतिक्रिया | |
|---|---|---|---|---|---|
| वर्तमान | 23:26, 27 जुलाई 2010 | | 986 × 574 (7 KB) | MGA73bot2 | == {{int:filedesc}} == {{Information |description={{en|1=This graph details the Test Match performance of Rahul Dravid. The red bars indicate the player's test match innings, while the blue line shows the [[:en:Ba |
चित्र का उपयोग
निम्नलिखित पन्ने इस चित्र से जुडते हैं :
चित्र का वैश्विक उपयोग
इस चित्र का उपयोग इन दूसरे विकियों में किया जाता है:
- en.wikipedia.org पर उपयोग