चित्र:Regression pic assymetrique.gif
इससे बड़ा रेसोल्यूशन उपलब्ध नहीं हैं।
Regression_pic_assymetrique.gif ((610 × 460 पिक्सेल, फ़ाइल का आकार: 22 KB, MIME प्रकार: image/gif), चक्रित, 10 ढाँचे, 5.0 s)
|
|
यह फ़ाइल विकिमेडिया कॉमन्स से है। वहाँ पर इसका विवरण पृष्ठ निम्नोक्त है। कॉमन्स मुक्त लाइसेंसों के अंतर्गत उपलब्ध मीडिया फ़ाइलों का संग्रह है। आप भी इसमें मदद कर सकते हैं। |
सारांश
| विवरण |
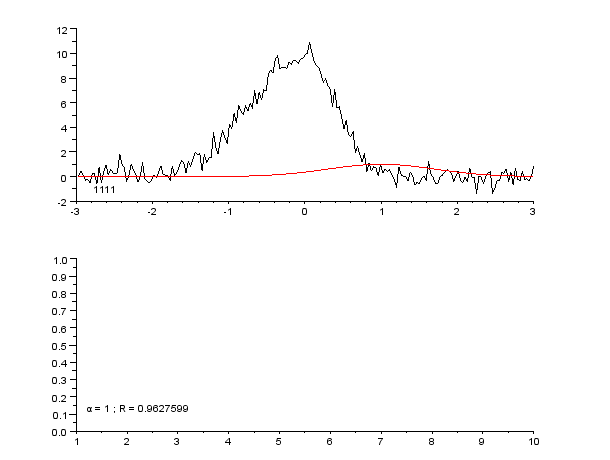
English: Successive steps of Gauss-Newton regression, with variable damping factor α, to fit a dissymetrical noisy peak.
Pictures created with Scilab, animated with The Gimp.
Français : Étapes successives d'une régression de Gauss-Newton, avec facteur d'amortissement α variable, pour ajuster un pic assymétrique.
Images créées avec Scilab ; animation créée avec The Gimp. |
| दिनांक | |
| स्रोत | अपना कार्य |
| लेखक | Cdang (Christophe Dang Ngoc Chan) |
Scilab source
 |
This media was created with Scilab, a free open-source software. Here is a listing of the Scilab source used to create this file. |
Le fichier de données et celui de fonctions communes sont identiques à ceux de File:Regression pic gaussien dissymetrique bruite.svg.
// **********
// Constantes et initialisation
// **********

clear;
clf;

chdir('monchemin/')

// Paramètres de Newton-Raphson
precision = 1e-7; // condition d'arrêt
itermax = 60; // idem

// Précision de la linéarisation approchée
epsilon = 1e-6;

// **********
// Fonctions
// **********

exec('fonctions_communes.sce', -1)

function [e] = res(Yexp, Ycal)
    e = sqrt(sum((Yexp-Ycal).^2));
endfunction

function [A, R] = gaussnewton(f, X, Yexp, A0, imax, epsilon)
    // A : jeu de paramètres optimisé par régression (vecteur)
    // R : liste des facteurs de qualité de la régression
    // pour chaque étape (vecteur)
    // X : variable explicative (vecteur)
    // Yexp : variable expliquée, valeurs mesurées (vecteur)
    // A0 : paramètres d'initialisation du modèle (vecteur)
    // epsilon : valeur d'arrêt (scalaire)
    k = 1; // facteur d'amortissement initial, <=1,
    // évite la divergence
    n = size(X,'*');
    e0 = sqrt(sum(Yexp.^2)); // normalisation du facteur de qualité
    Ycal = f(A0, X); // modèle initial
    R(1) = res(Yexp, Ycal)/e0; // facteur de qualité initial
    disp('i = 1 ; k = 1 ; R = '+string(R(1))) // affichage param initiaux
    i = 1;
    B = A0;
        subplot(2,1,1)
        plot2d(X, Yexp, rect=[-3, -2, 3, 12])
        plot(X, Ycal, "-r")
        xstring(-2.8, -1.5, string(B))
        subplot(2,1,2)
        plot2d(R, rect=[1, 0, 10, 1])
        xstring(1.2, 0.1, 'α = '+string(k)+' ; R = '+string(R(i)))
        nom = 'picassym'+string(i)+'.gif';
        xs2gif(0,nom)
    drapeau = %t;
    while (i < imax) & drapeau // teste la convergence globale
        i = i+1;
        deltay = Yexp - Ycal;
        J = linearisation_approchee(f, B, X, epsilon); // matrice jacobienne
        tJ = J'; // transposée
        deltap0 = inv((tJ*J))*tJ*deltay;
        drapeau2 = %t // pour une 1re exécution
        while drapeau2 & (k>0.1) // teste la divergence sur 1 étape
            deltap = k*deltap0;
            Bnouveau = B + deltap';
            Ycal = f(Bnouveau, X);
            R(i) = res(Yexp, Ycal)/e0;
            drapeau2 = (R(i) >= R(i-1)) // vrai si diverge
            if drapeau2 then k = k*0.75; // atténue si diverge
            else k0 = k; // pour affichage de la valeur
                k = (1 + k)/2; // réduit l'atténuation si converge
            end
        end
        B = Bnouveau;
        drapeau = abs(R(i-1) - R(i)) > epsilon
        clf;
        subplot(2,1,1)
        plot2d(X, Yexp, rect=[-3, -2, 3, 12])
        plot(X, Ycal, "-r")
        xstring(-2.8, -1.5, string(B))
        subplot(2,1,2)
        plot2d(R, rect=[1, 0, 10, 1])
        xstring(1.2, 0.1, 'α = '+string(k0)+' ; R = '+string(R(i)))
        nom = 'picassym'+string(i)+'.gif';
        xs2gif(0,nom)
//        disp('i = '+string(i)+' ; k = '+string(k0)+' ; R = '+string(R(i)))
    end
    A = B;
endfunction

// **********
// Programme principal
// **********

// lecture des données
donnees = read('pic_gauss_dissym_bruite.txt',-1,2);

// carcatéristiques des données
Xdef = donnees(:,1);
Ydef = donnees(:,2);
// Ainit = [-0.03, 9.7, 8*((0.84 - 0.03)/2.35)^2, 8*((0.45 + 0.03)/2.35)^2];
Ainit = [1, 1, 1, 1];

// Régression
tic();
[Aopt, Rnr] =...
    gaussnewton(gauss_dissym, Xdef, Ydef,...
    Ainit, itermax, precision)
t = toc();

// Courbe calculée

Yopt = gauss_dissym(Aopt, Xdef);

// Affichage

print(%io(2),Ainit)
print(%io(2),Aopt)
print(%io(2),t)

clf

subplot(2,1,1)
plot(Xdef, Ydef, "-b")
plot(Xdef, Yopt, "-r")

subplot(2,1,2)
plot(Rnr)
लाइसेंस
मैं, इस कार्य का/की कॉपीराइट धारक, इसे निम्न लाइसेंसों के अंतर्गत प्रकाशित करता/करती हूँ:

|
इस दस्तावेज़ को Free Software Foundation द्वारा प्रकाशित GNU मुक्त प्रलेख लाइसेंस के संस्करण 1.2 या नए (बिना किसी अपरिवर्तनीय अनुभागों और अगले या पिछले आवरण के टेक्स्ट के) के अंतर्गत प्रतिलिपि बनाने, बाँटने और/या बदलने की अनुमति प्रदान की जाती है। इस लाइसेंस की एक प्रतिलिपि GNU मुक्त प्रलेख लाइसेंस नामक अनुभाग में शामिल है। |
इस फ़ाइल को क्रिएटिव कॉमन्स श्रेय-समानसांझा 3.0 अनरिपोर्टेड, 2.5 साधारण, 2.0 साधारण और 1.0 साधारण लाइसेंस के अंतर्गत लाइसेंस किया गया है।
- आप खुलकर:
- बाँट सकते हैं – रचना की प्रतिलिपि बना सकते हैं, बाँँट सकते हैं और संचारित कर सकते हैं
- रीमिक्स कर सकते हैं – कार्य को अनुकूलित कर सकते हैं
- निम्नलिखित शर्तों के अंतर्गत:
- श्रेय – यह अनिवार्य है कि आप यथोचित श्रेय प्रदान करें, लाइसेंस की कड़ी प्रदान करें, और अगर कोई बदलाव हुए हों तो उन्हें इंगित करें। आप ऐसा किसी भी उचित तरीके से कर सकते हैं, लेकिन किसी भी तरह उससे यह नहीं संकेत नहीं किया जाना चाहिए कि लाइसेंसधारी द्वारा आपको अथवा आपके इस प्रयोग का समर्थन किया जा रहा हो।
- समानसांझा – अगर आप इस रचना में कोई बदलाव करते हैं या इसपर आधारित कुछ रचित करते हैं तो आप अपने योगदान को सिर्फ इसी या इसके सामान किसी लाइसेंस के अंतर्गत बाँट सकते हैं।
आप अपना पसंद का लाइसेंस चुन सकते हैं।
चित्र का इतिहास
फ़ाइलका पुराना अवतरण देखने के लिये दिनांक/समय पर क्लिक करें।
| दिनांक/समय | थंबनेल | आकार | सदस्य | प्रतिक्रिया | |
|---|---|---|---|---|---|
| वर्तमान | 13:13, 5 दिसम्बर 2012 | | 610 × 460 (22 KB) | Cdang | {{Information |Description ={{en|1=alpha (damping factor) value corrected}} |Source ={{own}} |Author =Cdang |Date = |Permission = |other_versions = }} |
| 13:09, 5 दिसम्बर 2012 |  | 610 × 460 (22 KB) | Cdang | {{Information |Description ={{en|1=Successive steps of Gauss-Newton regression, with variable damping factor α, to fit a dissymetrical noisy peak. Pictures created with Scilab, animated with The Gimp.}} {{fr|1=Étapes successives d'une régression... |
चित्र का उपयोग
निम्नलिखित पन्ने इस चित्र से जुडते हैं :
चित्र का वैश्विक उपयोग
इस चित्र का उपयोग इन दूसरे विकियों में किया जाता है:
- als.wikipedia.org पर उपयोग
- ar.wikipedia.org पर उपयोग
- ca.wikipedia.org पर उपयोग
- de.wikipedia.org पर उपयोग
- en.wikipedia.org पर उपयोग
- fa.wikipedia.org पर उपयोग
- fr.wikipedia.org पर उपयोग
- it.wikipedia.org पर उपयोग
- ru.wikipedia.org पर उपयोग
- simple.wikipedia.org पर उपयोग
- sv.wikipedia.org पर उपयोग
- zh.wikipedia.org पर उपयोग